Seven Thousand Questions, One Hundred Fifty-Two Categories
You have 6,954 survey questions and need to classify them into a 152-category taxonomy. Suppose a single model gets about 85% right on its first pass. Is that good enough?
The answer depends entirely on what you do with the other 15%, and whether you can even identify which 15% it is. A wrong classification label does not throw an exception. It does not produce an error message. It sits quietly in your output file, propagating downstream into whatever analysis depends on it. Classification errors are silent errors, and silent errors are the most dangerous kind in any statistical workflow.
Classification is the natural entry point for LLMs in statistical work. It maps to tasks agencies already do: occupation coding, industry coding, document categorization, survey question mapping, response classification. It maps to what LLMs already do well: pattern matching against structured taxonomies. And unlike open-ended text generation, classification tasks have ground truth, or at least expert consensus, which means they are evaluable. You can measure whether the system is working.
But “works in a demo” is not “reliable enough for production.” The gap is entirely a design problem. And the design patterns that close it are not invented from scratch. They are borrowed from what statisticians already know about inter-rater reliability, applied to a new kind of rater.
This chapter uses the Federal Survey Concept Mapper Webb, 2026 as the primary case study: 6,954 survey questions classified into a 152-subtopic Census taxonomy using dual-model cross-validation, structured arbitration for disagreements, and a complete evidence chain. Topic-level agreement between independent models: Cohen’s κ = 0.839. Total classification cost: approximately $15 in API fees. The design patterns that produced these results are the subject of this chapter. The specific models are interchangeable. The architecture is the durable asset.
Why Classification First
LLMs have a structural advantage over traditional NLP approaches for classification tasks. They can reason about hierarchical taxonomies, weigh contextual clues, and handle the kind of semantic ambiguity that trips up keyword matching and even embedding-based similarity methods. They can read a 100-word survey question and determine that it belongs to “Employment Status” rather than “Labor Force Participation” based on nuance that no bag-of-words model would catch.
But a single LLM call is a single opinion from a single rater. Statisticians would never accept a classification study design that relies on a single rater without measuring reliability. The entire field of inter-rater reliability exists because individual raters are biased, inconsistent, and occasionally wrong. Why would you accept a single model’s judgment without the same scrutiny?
The stochastic tax from Chapter 1 gets its first concrete application here. Every classification you accept from a single model call is a classification you accepted without any internal consistency check. You paid the stochastic tax (used a probabilistic system instead of a deterministic one) and got nothing back for it: no confidence measure, no disagreement signal, no evidence trail. The design patterns in this chapter exist to extract value from the stochastic tax you are already paying.
Try the cheap thing first. Before using LLMs at all, the Concept Mapper project tested whether semantic embeddings (RoBERTa-large) could match questions to taxonomy labels through cosine similarity. The result: perfectly flat distributions. Every question was equally similar to every concept, approximately 0.64% each after normalization, with negligible variance. The root cause was information asymmetry: comparing 100-word detailed questions to 2-word concept labels is like comparing a novel to the single word “mystery.” The failure was empirically documented and provided clear justification for moving to LLMs. This is the right engineering approach: try the cheaper method, document why it fails, then move to the more capable and more expensive tool with evidence.
Think about a classification task in your own work. How would you know if your model was getting it wrong? What would “wrong” even mean: wrong category, wrong confidence, or wrong for a reason that matters downstream?
The Single-Model Trap
One model, one call, one answer. What is wrong with this picture?
No internal consistency check. You cannot distinguish confident-and-correct from confident-and-wrong. The model returns the same high-confidence score whether its answer is right or not, because confidence in an LLM is a property of the token distribution, not a calibrated probability of correctness.
No position bias detection. The order in which classification options are presented to the model affects the result, an LLM analogue of the primacy and recency effects in survey methodology. With a single model and a fixed prompt, you would never detect this. The bias is baked into the result and invisible.
No systematic bias detection. A single model’s training data and alignment create blind spots that are invisible from inside that model’s outputs. When a single system’s tendencies dominate your results, the outputs feel polished and consistent, but they are predictably biased in ways you cannot see without an external reference point. This is the algorithmic echo chamber: coherent, confident, and systematically skewed.
The analogy is direct. Running a classification workflow with a single model and no cross-validation is the same as running a survey with a single interviewer and no inter-rater reliability checks. No methodologist would accept that design. The same logic applies here.
The point is not that single-model classification is always wrong. It is that single-model classification gives you no way to measure your own uncertainty. The fix is not more models for the sake of more models. It is designing your system to produce its own quality metrics. The dual-model pattern that follows is one way to achieve that. It is not the only way. But it is concrete, proven, and directly analogous to methods the statistical community already uses.
Dual-Model Cross-Validation
The Concept Mapper uses two architecturally distinct models, from different vendors, with different training data and different alignment approaches, to classify independently. Each model receives the same question and the same taxonomy. Neither knows what the other said.
The agreement analysis routes outputs through three paths. The first two are deterministic logic gates; no additional model is involved. Only the third path invokes an arbitrator.
Consensus (68.5% of classifications). Both models agree on topic and subtopic. Auto-accept. When two independently trained systems with different architectures and different training data arrive at the same answer independently, you have a meaningful signal. Not proof, but signal. No further processing needed. This is a logic gate: agreement triggers acceptance.
Dual-modal assignment (11.8%). Both models are highly confident (≥0.90) but assign different primary topics. Rather than forcing a resolution, the pipeline accepts both: the higher-confidence model’s topic as primary, the lower-confidence model’s topic as secondary. No arbitrator is invoked. This is a logic gate, not a model decision.
This was a deliberate engineering choice, not an oversight. With 152 subtopics distributed across five broad topics, genuine taxonomic ambiguity is common. A question about health insurance costs could reasonably classify under Economic or Social topics. If the models are both confident but pointing in different directions, forcing a single answer discards a signal. Preserving both assignments broadens downstream matching: it is a form of fuzzy matching through the classification layer that accepts ambiguity rather than prematurely collapsing it.
The trade-off: dual-modal assignments generate more downstream calculations, since questions with two topic assignments get compared against both topic pools. At 11.8%, that cost was manageable. If the dual-modal rate had been substantially higher, say 30% or more, that would have signaled a prompt design problem or a taxonomy mismatch worth investigating before proceeding. The low rate confirmed that the taxonomy was working and that true ambiguity, not systematic confusion, was driving the disagreements.
The dual-modal assignments were spot-checked manually. The ones reviewed were defensible: reasonable arguments could be made for either topic assignment. This is a quality control trade-off: the spot check was not a statistically designed sample with a calculated confidence interval, and the individual reviews were not logged as artifacts. For a higher-stakes application, more formal sampling and documentation would be warranted. Here, the risk of a wrong topic assignment was additional downstream calculations, not wrong answers, a cost the pipeline could absorb.
Arbitration (19.7%). Models disagree and at least one has low confidence. These are the cases where the system genuinely does not know, and a deterministic rule cannot resolve the disagreement. Only here does the pipeline escalate to a more capable arbitrator model, which reviews both prior judgments and renders a structured verdict with reasoning. This is the only path that invokes a third model.
The key design insight: disagreement is signal, not noise. When two independently trained systems disagree, one of three things is true. One is wrong and the other is right. Both are wrong. Or the question is genuinely ambiguous and belongs in multiple categories. All three are valuable information. A single model would silently pick one answer and hide the ambiguity from you entirely.
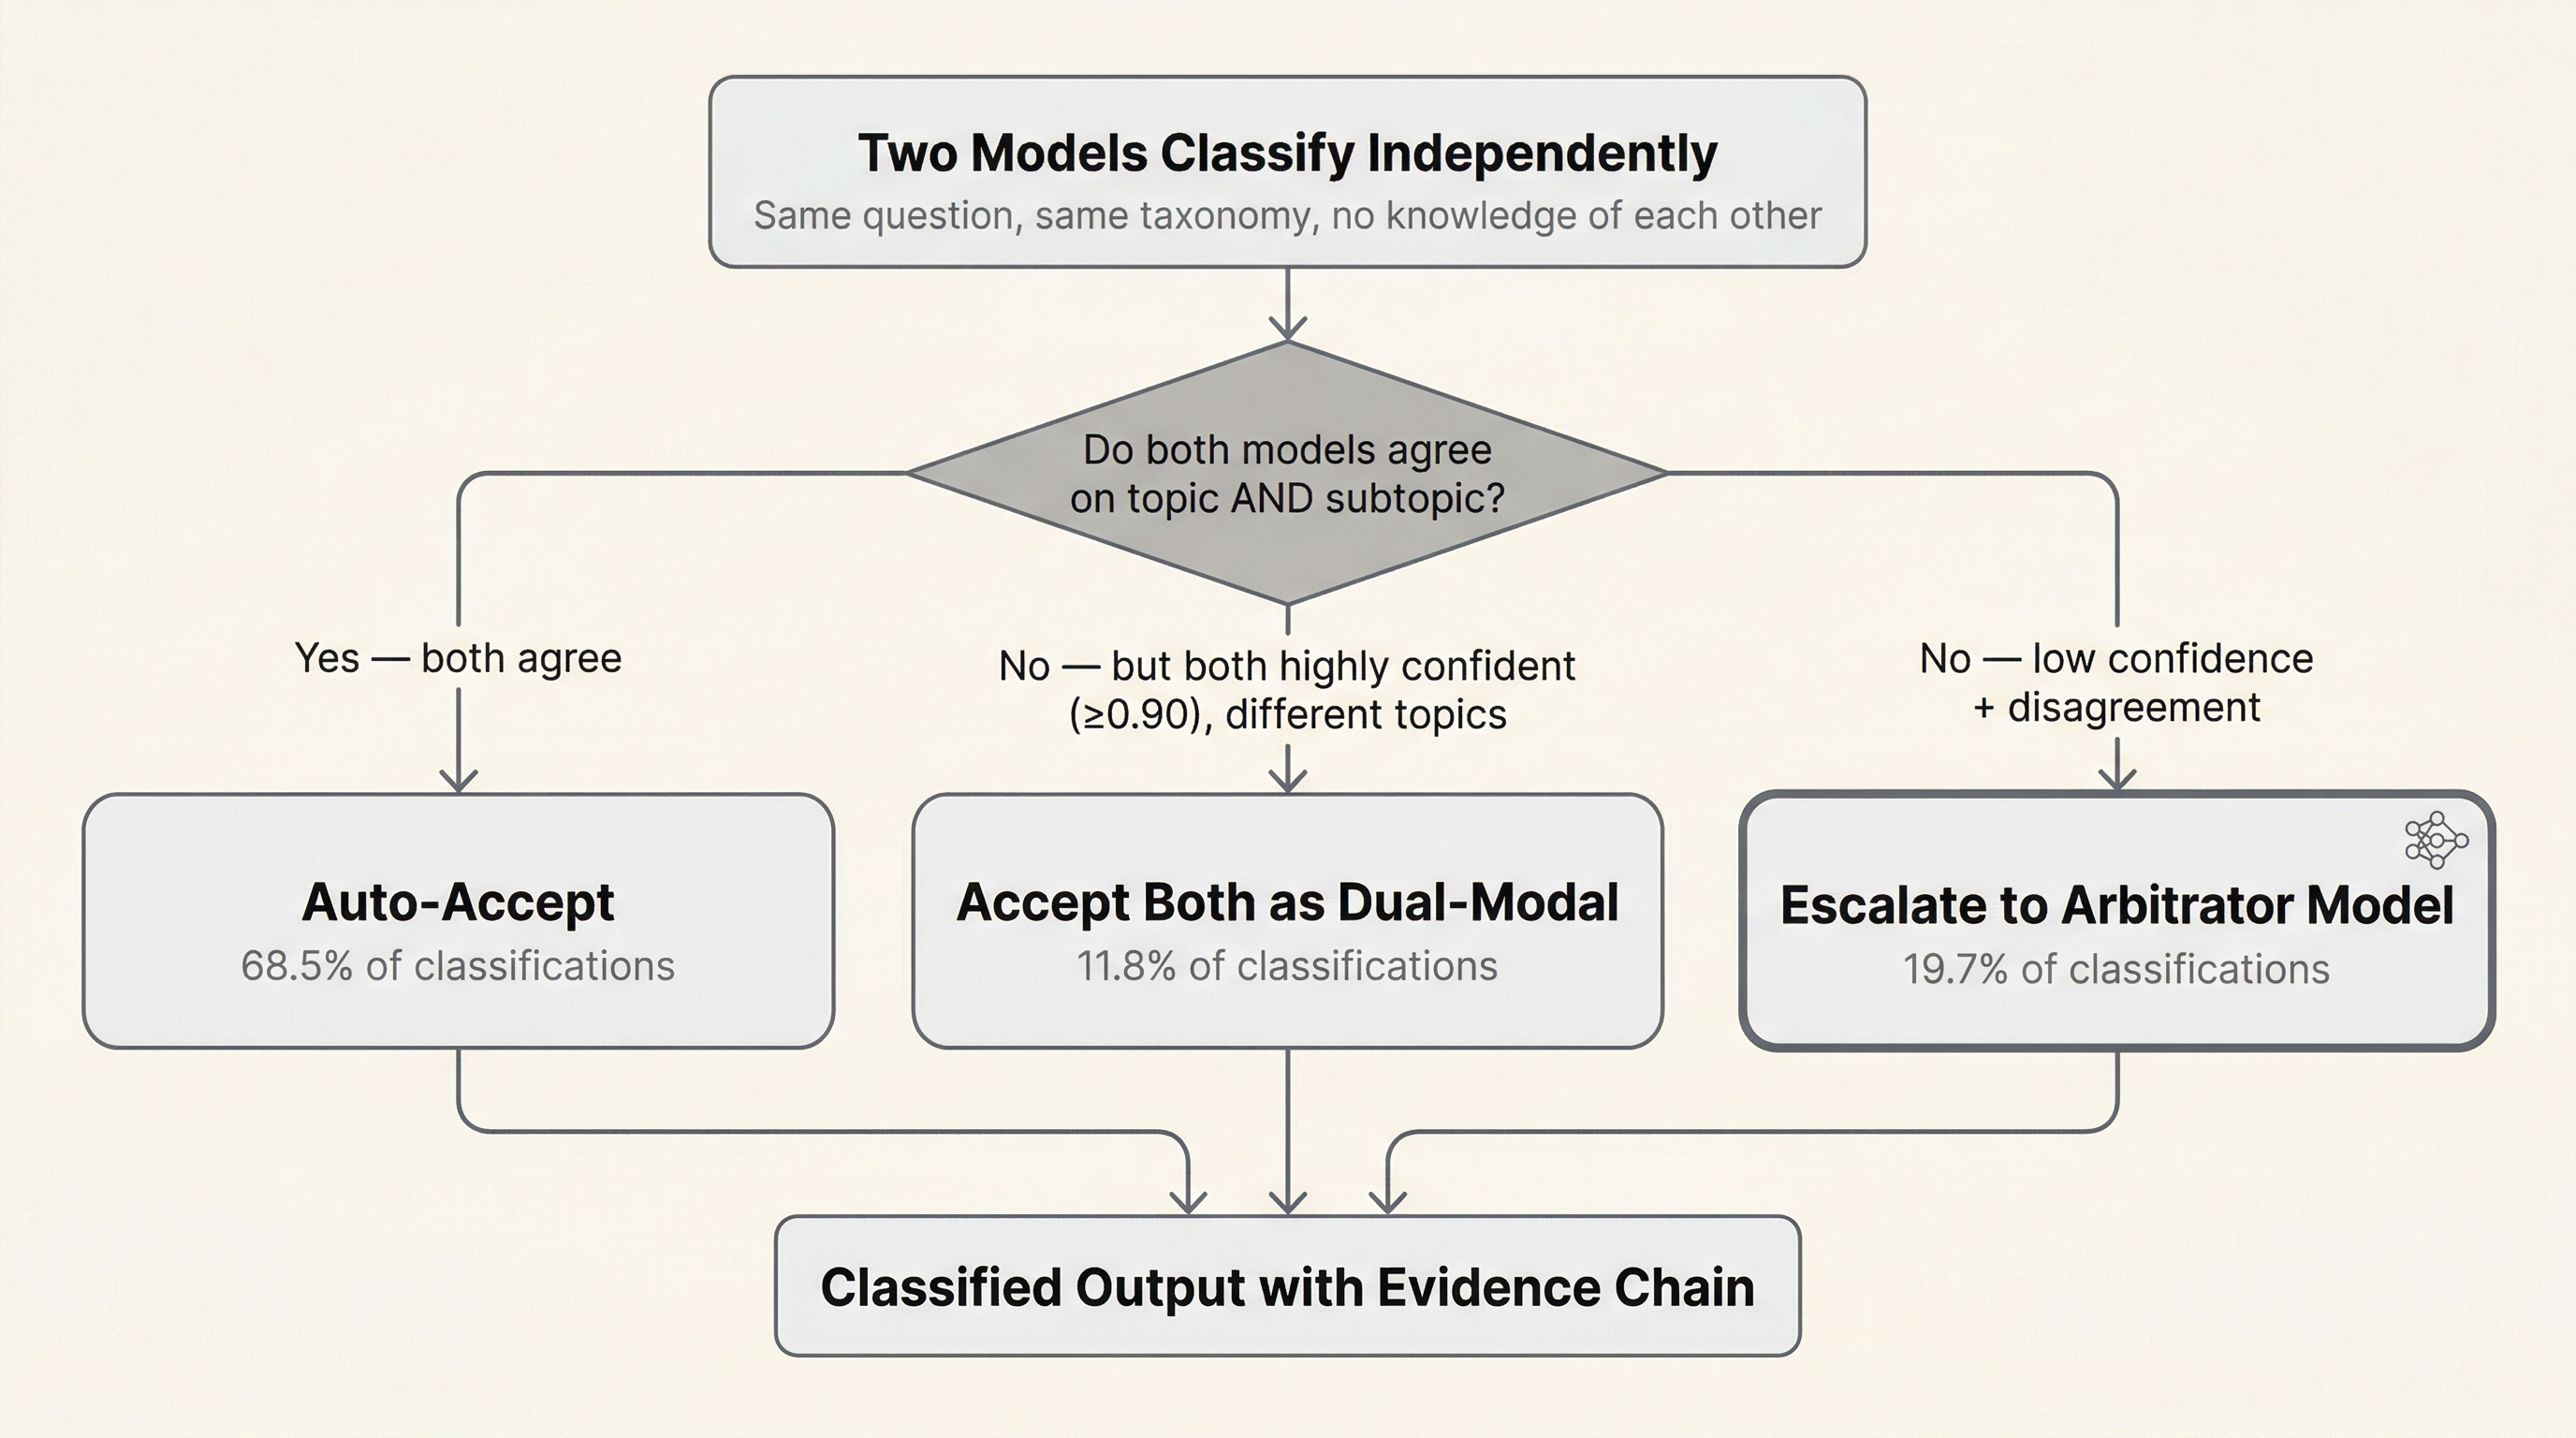
Figure 1:Classification routing in the dual-model pattern. Independent models classify each item; routing is determined by agreement level and confidence scores.
LLMs are independently trained neural networks, just as human raters are independently trained neural networks, with very different architectures but the same fundamental property: independent training produces independent biases. The independence is imperfect (models from different vendors still share overlapping training corpora) but it is stronger than within-vendor model diversity and sufficient to surface meaningful disagreement signals. The methods for managing variability across human raters, inter-rater reliability statistics, agreement analysis, structured arbitration protocols, apply directly. This is not a novel methodological insight. It is a transfer of existing statistical methodology to a new context. The gap is that most people building with LLMs come from software engineering, where determinism is the default expectation, rather than from the statistical sciences, where managing variability is the core discipline.
Topic-level agreement between the two models: Cohen’s κ = 0.839. Subtopic-level agreement: κ = 0.687. The subtopic disagreement at finer granularity is expected and informative. It tells you where the taxonomy’s boundaries are blurry, not where the models are failing.
Every one of these routing decisions (what threshold triggers auto-accept, whether to preserve dual-modal ambiguity or force resolution, when to invoke a more expensive arbitrator) is an engineering judgment that depends on context. The Concept Mapper is an example, not a prescription. A different taxonomy, a different downstream use, or a different risk profile would justify different choices. The point is not to copy this specific pipeline. It is to recognize that these are design decisions that should be made deliberately, documented as artifacts, and defensible under review. When someone asks why you accepted dual-modal assignments instead of forcing arbitration, you should have an answer grounded in your analysis of the trade-offs, not a shrug.
If both models agree on a wrong answer, what does that tell you about the taxonomy, not the models? When should you suspect that agreement is masking a shared blind spot?
Confidence Routing and the Division of Labor
Not every classification needs the same treatment. The Concept Mapper implements confidence-based routing that directs attention where it adds the most value. Items with high agreement and high confidence are auto-accepted; the vast majority of classifications require no human attention at all. Items with high agreement but borderline characteristics get flagged for periodic batch review, a sample-based quality check rather than exhaustive review. Where models disagree, a more capable model arbitrates with full context of both prior judgments. And for items where all models struggle, the approximately 38 questions (0.55%) that resisted automated resolution are routed to human domain experts.
Out of 1,598 question pairs evaluated in the harmonization stage, only 142 candidate bridge variables needed expert review. The pipeline reduced expert workload by an order of magnitude, not by replacing expert judgment but by directing it where it actually matters. AI handles volume. Humans handle judgment. The pipeline’s job is to sort the easy cases from the hard cases and present experts with a curated review list, not a haystack.
The dual-model classification of 6,954 questions cost approximately $15 in API fees and ran in about two hours. The full pipeline, including barrier rating and arbitration across three rater models and three arbitrator models, cost under $100 in total API fees. Manually classifying 7,000 questions into 152 categories would take months of analyst time. The API cost is real, but it is not the whole story. The human engineering cost to design, debug, and validate the pipeline dwarfed it by orders of magnitude. That ratio shifts as you build reusable patterns and accumulate experience, but the first pipeline is always the most expensive in engineering hours per dollar of API spend. Chapter 14 addresses cost accounting in full.
Order Effects and the ABBA Design
Position bias: the order in which options or question pairs are presented to a model affects its output. This is well-documented in survey methodology as primacy and recency effects, and it is equally present in LLM behavior Li et al., 2023.
ABBA counterbalancing is a standard technique from repeated-measures experimental design: by reversing presentation order across conditions, order-dependent variance is exposed rather than hidden.
The ABBA design addresses this directly. For every evaluation, randomize the presentation order. If the model’s judgment changes when Question A is presented before Question B versus after, the judgment is unstable and should not be trusted. Instability under order permutation is a measurement quality signal, not a classification quality signal.
In the Concept Mapper’s harmonization stage, all three rater models received question pairs with randomized A/B order. All three arbitrator models received prior judgments in randomized order with blind masking, vendor identities removed, to prevent anchoring on whichever judgment appeared first.
The practical takeaway is general: any time you ask a model to compare, rank, or choose between options, randomize the presentation order and check whether the results are order-invariant. If they are not, you have a measurement design problem, not a classification performance problem. Fix the design before blaming the model.
What other sources of systematic bias could affect your classifications that order randomization will not catch? Think about the taxonomy itself, the prompt wording, and the training data.
Arbitration: When Models Disagree
What happens when the raters do not agree? The Concept Mapper uses a structured protocol that mirrors best practices in human inter-rater reliability studies.
Three independent rater models, one per vendor (OpenAI, Anthropic, Google), evaluate each pair on feasibility and barrier type. Initial agreement: Fleiss’ κ = 0.537 for feasibility, 0.611 for barrier classification. Moderate Landis & Koch, 1977, which is expected at the rater stage.
Three independent arbitrator models, higher-capability models from the same three vendors, review all pairs with access to all prior judgments. Blind masking prevents anchoring on any particular vendor’s output. Order randomization prevents position bias. Post-arbitration agreement: κ = 0.843 for feasibility, 0.796 for barrier classification. Near-perfect.
The pattern: moderate initial agreement converging to near-perfect after structured arbitration. This validates that the task is well-defined and that independent models can reach consensus when given a protocol for resolving ambiguity.
Why three vendors, not three models from one vendor? Vendor diversity is a stronger independence guarantee than model diversity within a single vendor’s family. Models from the same vendor likely share training pipelines, alignment approaches, and organizational biases. Cross-vendor agreement is harder to achieve and, in the author’s experience, more meaningful when it occurs. This is the methodological equivalent of requiring independent expert raters from different institutions.
Why not just take the majority vote? Majority vote discards reasoning. The arbitration protocol requires the arbitrator to select or synthesize a verdict and provide reasoning. That reasoning is a traceable artifact: you can audit why a particular classification was made. Majority vote gives you an answer. Arbitration gives you an answer with a justification.
The barrier taxonomy used in the harmonization stage (feasibility tiers, barrier codes) was adopted from established survey harmonization frameworks: DataSHaPER Fortier et al., 2011Fortier et al., 2017 and Wolf et al. (2016). This is itself a design pattern: use established domain frameworks as your structured output schema rather than inventing your own. When your LLM outputs map to categories that domain experts already recognize, validation is dramatically easier. You are not asking experts to learn a new taxonomy. You are asking them to verify that a familiar taxonomy was applied correctly.
Model Transience as a Design Constraint
The models you use today will not be the models you use in six months. They may be deprecated, superseded, repriced, or subtly changed through updates. Your prompts may stop working. Your benchmarks may shift. This is not a surprise. It is a design constraint. Design for it.
Golden questions. Maintain a small, human-validated set of classification examples with known correct answers. Run them through your pipeline on a regular schedule; weekly is cheap. Compare results to your baseline. If agreement degrades, investigate before the drift propagates through your production outputs.
Model-agnostic pipeline design. Your pipeline should specify roles, rater and arbitrator, not specific model names. Swapping one model for another should be a configuration change, not a code rewrite. The evaluation harness from Chapter 8 determines which model currently fills each role. Chapter 3 examines the fine-tuning versus API tradeoff for classification tasks directly, including the cost and maintenance implications that affect which side of this design constraint you land on.
Version pinning with expiration dates. Pin your model versions for reproducibility within a production run. But schedule regular reviews. A model version that is a year old may no longer be available, or may have been quietly updated by the provider.
The broader point: the design patterns in this chapter, dual-model cross-validation, confidence routing, structured arbitration, are model-independent. The specific models are interchangeable. The architecture is the durable asset. Chapter 9 treats model transience as a formal validity concern through the SFV framework. This section plants the practical seed.
Provenance: What Happens Six Months Later
The Concept Mapper produced reliable results. Reconstructing how those results were produced, which model versions, which prompts, which arbitration decisions, which intermediate outputs, after the fact was a multi-day effort. The pipeline worked. The provenance was not baked in.
This is a common pattern in early LLM projects. Output quality and process traceability are decoupled. You get great results and no audit trail. For a research project, that is recoverable, painfully. For a production system in a statistical agency, it is a showstopper, because institutional trust requires not just correct results but demonstrable provenance of how those results were produced.
The lesson: build traceability from the start. Log your model versions, prompt templates, input hashes, confidence scores, and arbitration decisions as pipeline artifacts, not as afterthoughts. Every classification should be traceable to the specific models that produced it, the prompts they received, the confidence scores they returned, and the decision rule that accepted the result. Chapter 10 provides the full treatment of provenance engineering.
Thought Experiment
You are tasked with coding 500,000 job descriptions into Standard Occupation Classification (SOC) codes. You have budget for 10,000 human-coded training examples and access to two LLM APIs. Design the workflow:
Which job descriptions get human-coded first? Not a random sample. Think about taxonomy coverage and edge cases.
How do you route classifications: which go to auto-accept, which to human review?
How do you detect when your system is degrading over time, and what triggers a recalibration?
At what point does adding a third model help, and at what point is it just adding cost and complexity?
This connects forward to Chapter 8 (evaluation by design) and Chapter 9 (drift detection).
Classification produces structured labels. Those labels are only as useful as what you do with them downstream. If you are cleaning data, the classifications tell you which records to route to which cleaning rules (Chapter 3). If you are extracting entities, the classifications scope the extraction task (Chapter 4). And the ensemble and arbitration patterns introduced here, dual-model cross-validation, confidence routing, structured disagreement resolution, are cross-cutting designs that apply to every workflow in this book. Chapter 5 generalizes them into the multi-model playbook.
But first: a classification label on a dirty record is a label on a dirty record. Chapter 3 addresses what happens when the data itself needs repair.
- Webb, B. (2026). AI-Assisted Federal Survey Harmonization: Cross-Survey Integration Analysis of 47 Census Bureau Demographic Surveys. Draft working paper. https://github.com/brockwebb/federal-survey-concept-mapper
- Li, P., Chen, T., & others. (2023). Large Language Models Sensitivity to the Order of Options in Multiple-Choice Questions. arXiv Preprint arXiv:2308.11483. https://arxiv.org/abs/2308.11483
- Landis, J. R., & Koch, G. G. (1977). The Measurement of Observer Agreement for Categorical Data. Biometrics, 33(1), 159–174.
- Fortier, I., Doiron, D., Little, J., & others. (2011). Is Rigorous Retrospective Harmonization Possible? Application of the DataSHaPER Approach Across 53 Large Studies. International Journal of Epidemiology, 40(5), 1314–1328. 10.1093/ije/dyr106
- Fortier, I., Raina, P., van den Heuvel, E. R., & others. (2017). Maelstrom Research Guidelines for Rigorous Retrospective Data Harmonization. International Journal of Epidemiology, 46(1), 103–115. 10.1093/ije/dyw075
- Wolf, C., Schneider, S. L., Behr, D., & Joye, D. (2016). Harmonizing Survey Questions Between Cultures and Over Time. In C. Wolf, D. Joye, T. W. Smith, & Y. Fu (Eds.), The SAGE Handbook of Survey Methodology (pp. 502–524). SAGE.